Top Video Streaming Performance Metrics to Look For
To attract and retain consumers, you need to understand streaming metrics.
These measures help platforms deliver seamless video streaming experiences by providing valuable insights on user behavior, demographics, and more. But what are video streaming performance metrics, and how can they impact your IPTV or OTT service? Read on to find all the answers.
Key Takeaways
- Maintaining high-quality user experiences on OTT and IPTV platforms relies on tracking video streaming performance metrics.
- Streaming quality and user satisfaction indicators are buffering rate, video start-up time, and CDN speed.
- Improving video streaming performance reduces churn, increases audience retention, and boosts engagement.
- Real-time monitoring and troubleshooting require practical tools and techniques, including performance-tracking systems.

What Are Video Streaming Performance Metrics?
Video streaming performance metrics are measurable data points that assess the quality, reliability, and efficiency of your streaming platform. These metrics serve as a diagnostic toolkit for identifying technical or user-experience issues and provide actionable insights for improving content delivery.
Why Are These Metrics Important?
Without clear insights into performance, businesses risk delivering subpar experiences that drive users to competitors. For instance:
- A high buffering ratio frustrates viewers, often causing them to abandon content mid-stream.
- Delayed video start times create impatience, leading to lower retention.
- Poor viewer engagement metrics may signal irrelevant content or inadequate personalization.
Example: Imagine your user is trying to watch a popular TV series. If the video starts buffering repeatedly or takes more than five seconds to load, chances are they will abandon the platform entirely, potentially leaving negative reviews. This highlights why continuous monitoring of streaming metrics is indispensable.
Essential Video Streaming Performance Metrics
 Tracking key performance metrics that directly impact user satisfaction and platform efficiency is crucial for delivering a flawless streaming experience. Here are five critical metrics:
1. Buffering Ratio
Definition: The percentage of viewing time spent buffering.
A low buffering ratio (<1%) is important for a positive user experience. Frequent interruptions can frustrate viewers, leading to churn. Buffering often occurs due to bandwidth limitations, overloaded servers, or poorly optimized content delivery networks (CDNs).
How to Improve Buffering Ratio:
- Use adaptive bitrate streaming to deliver content tailored to the user’s connection speed.
- Employ multi-CDN strategies to reduce server load and improve content delivery efficiency.
- Monitor network conditions in real time to preemptively address bottlenecks.
2. Video Start Time
Definition: The time taken for a video to begin playing after the user hits play.
Research suggests that users expect videos to start within 3 seconds; delays beyond this threshold lead to a steep drop-off in viewer engagement. Slow start times are often caused by network latency, server delays, or inefficient content preloading.
Optimization Techniques:
- Preload video content or cache frequently accessed data closer to end users.
- Optimize server response times through load balancing and edge computing.
- Reduce latency using geographically distributed servers.
3. Playback Errors
Definition: Failures that occur during video playback, such as freezing, crashing, or skipping.
High playback error rates can damage your platform’s reputation and result in user dissatisfaction. Playback errors may occur due to codec mismatches, hardware limitations, or network issues.
Solutions:
- Test content across devices and operating systems to ensure compatibility.
- Use error-detection analytics to identify and address issues preemptively.
- Streamline encoding processes to deliver universally compatible formats.
4. Viewer Engagement
Definition: Video streaming performance metrics that measure how users interact with your content, including session length, average watch time, and completion rates.
High engagement indicates that your content is relevant and captivating. Conversely, low engagement may signal issues with content quality, recommendations, or user experience.
Tips to Improve Engagement:
- Personalize content recommendations using AI algorithms.
- Introduce features like interactive menus, skip intros, and dynamic playlists.
- Regularly analyze viewing patterns to refine your content strategy.
5. Latency
Definition: The delay between a video’s broadcast and its delivery to the viewer.
For live streaming, particularly in events like sports or e-sports, low latency is non-negotiable. High latency can disrupt real-time interactions, reducing user satisfaction.
How to Reduce Latency:
- Implement ultra-low-latency streaming protocols like WebRTC.
- Use edge servers to bring content closer to users.
- Leverage network optimization tools to minimize transmission delays.
User Experience Metrics
Evaluating how well your IPTV or OTT platform meets viewer expectations requires tracking user experience metrics. These indicators provide insights for improving customer satisfaction and retention:
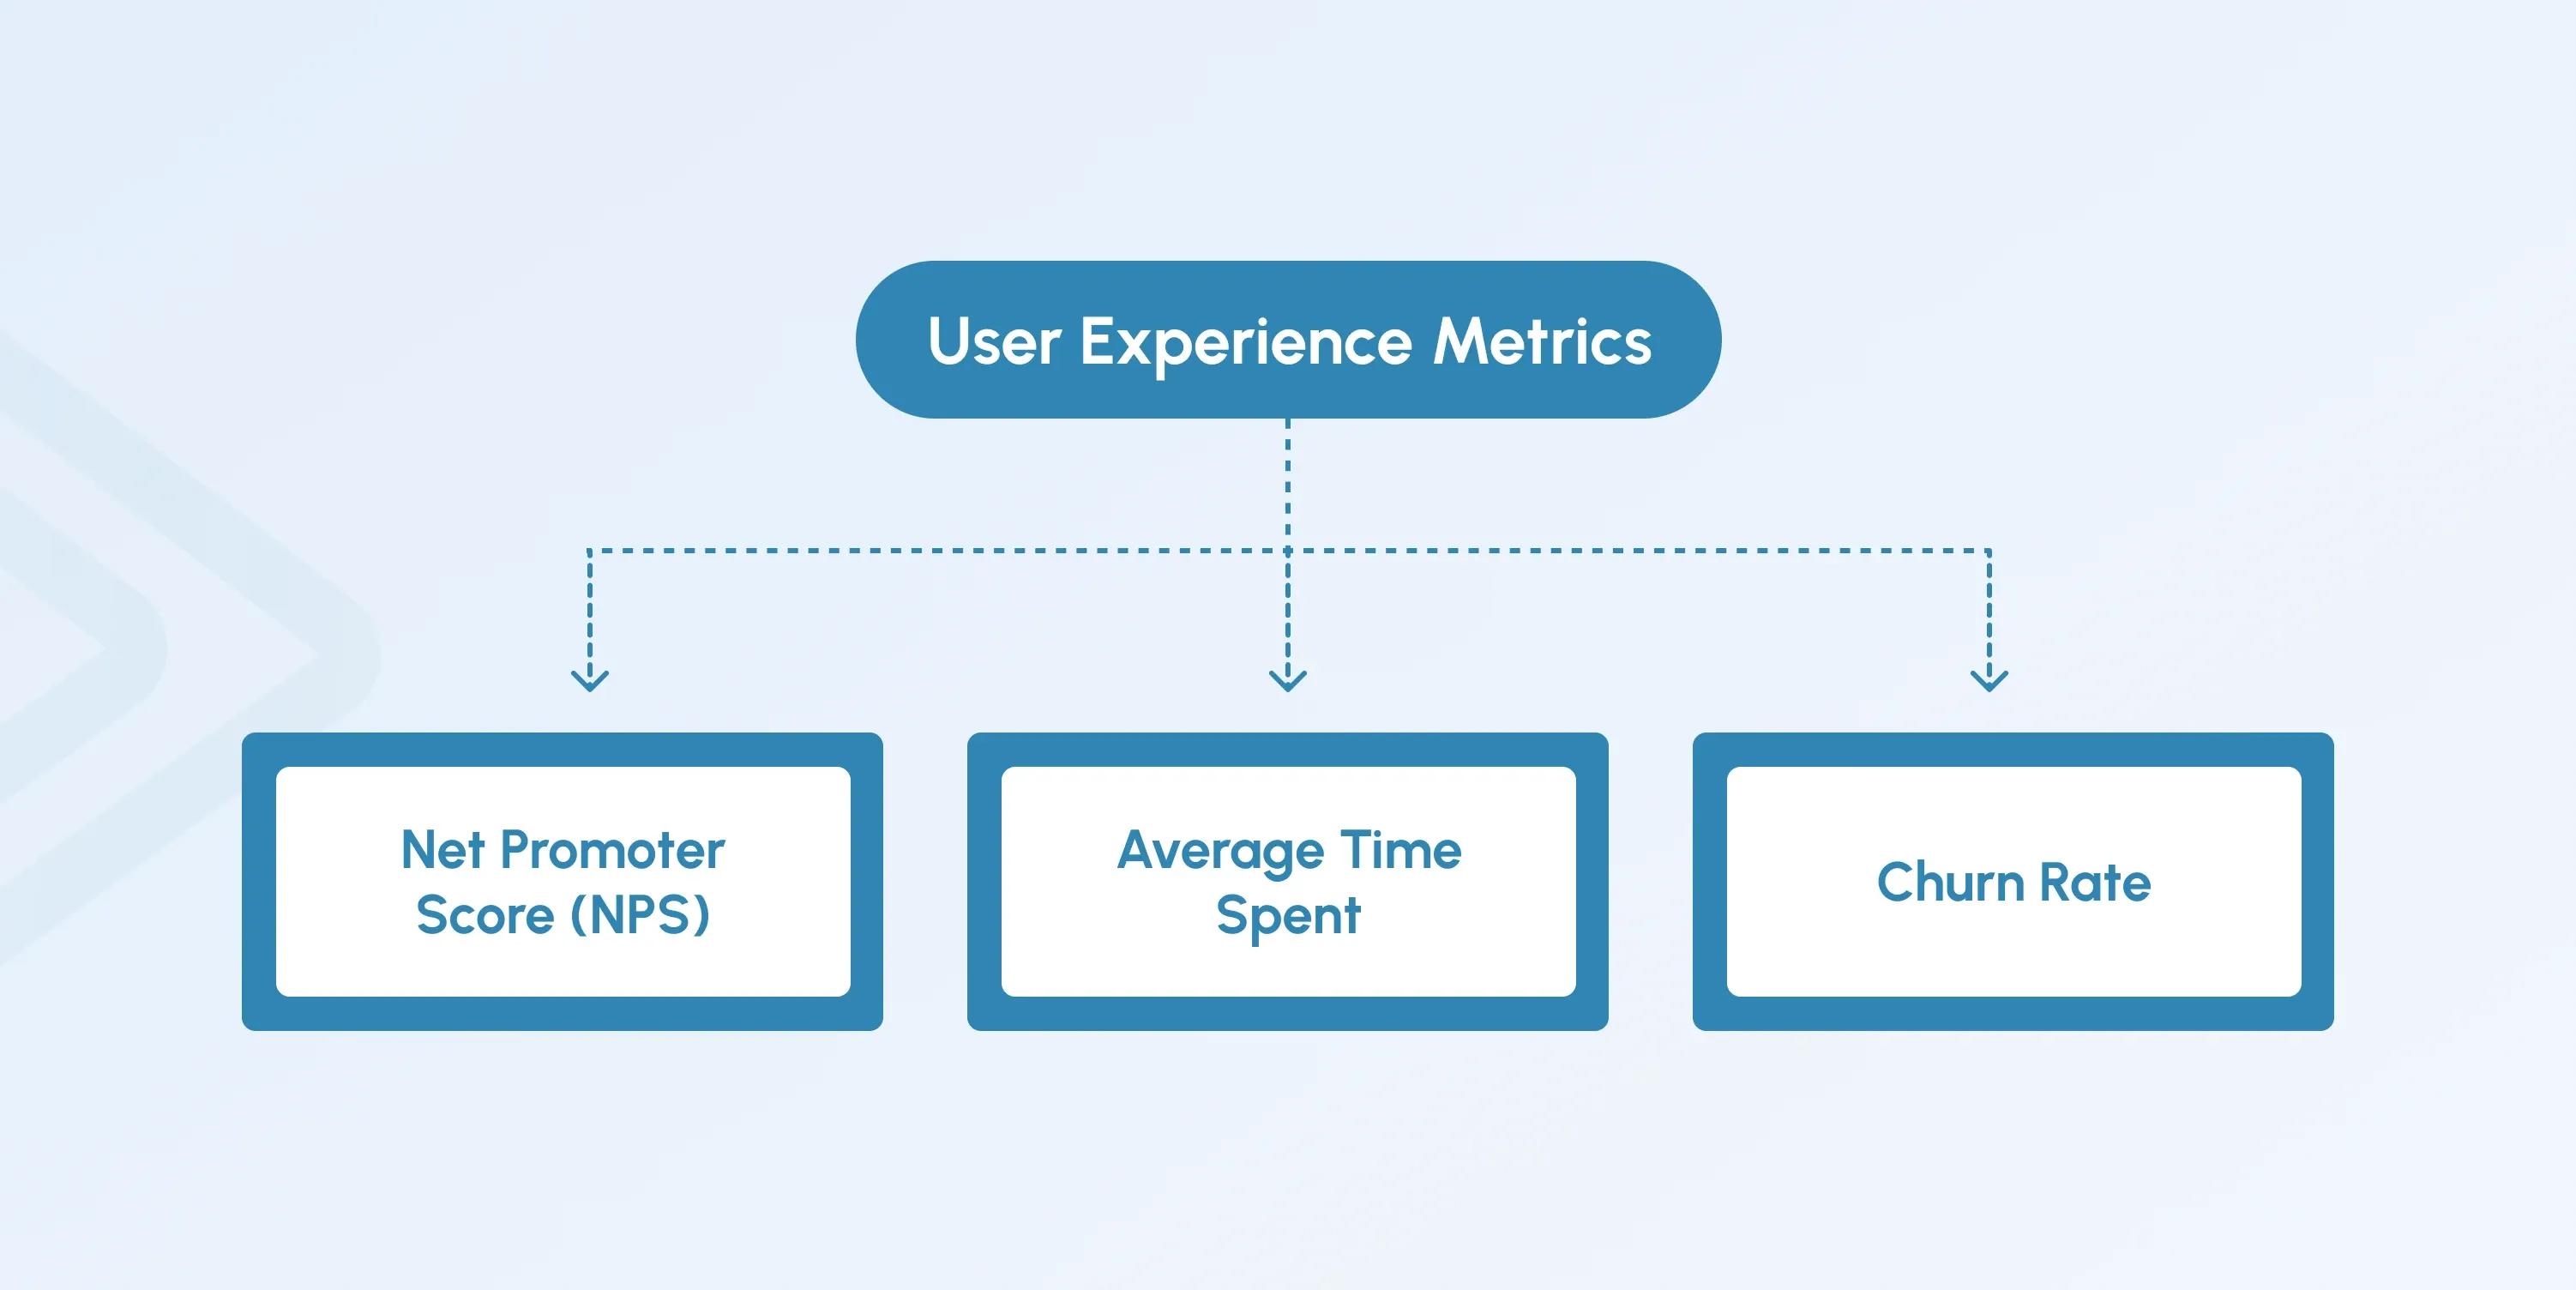
- Net Promoter Score (NPS): Measures the likelihood of viewers recommending your platform. A high NPS indicates strong loyalty, while a low score highlights areas for improvement, such as platform usability or content quality.
- Average Time Spent: Indicates how long viewers remain on the platform. Longer sessions suggest an engaging interface and compelling content.
- Churn Rate: Reflects the percentage of users discontinuing the service. Monitoring this metric helps identify the issues that drive customer loss.
Improving User Metrics
- Simplify the user interface for better navigation.
- Regularly update your content library to meet audience preferences.
- Offer personalized onboarding experiences to new users.
Content Delivery Network (CDN) Metrics
To evaluate the effectiveness and dependability of content distribution, CDN indicators are essential streaming metrics. By reducing buffering and improving the watching experience, these measurements ensure that video content is distributed to consumers worldwide in a timely and effective manner.
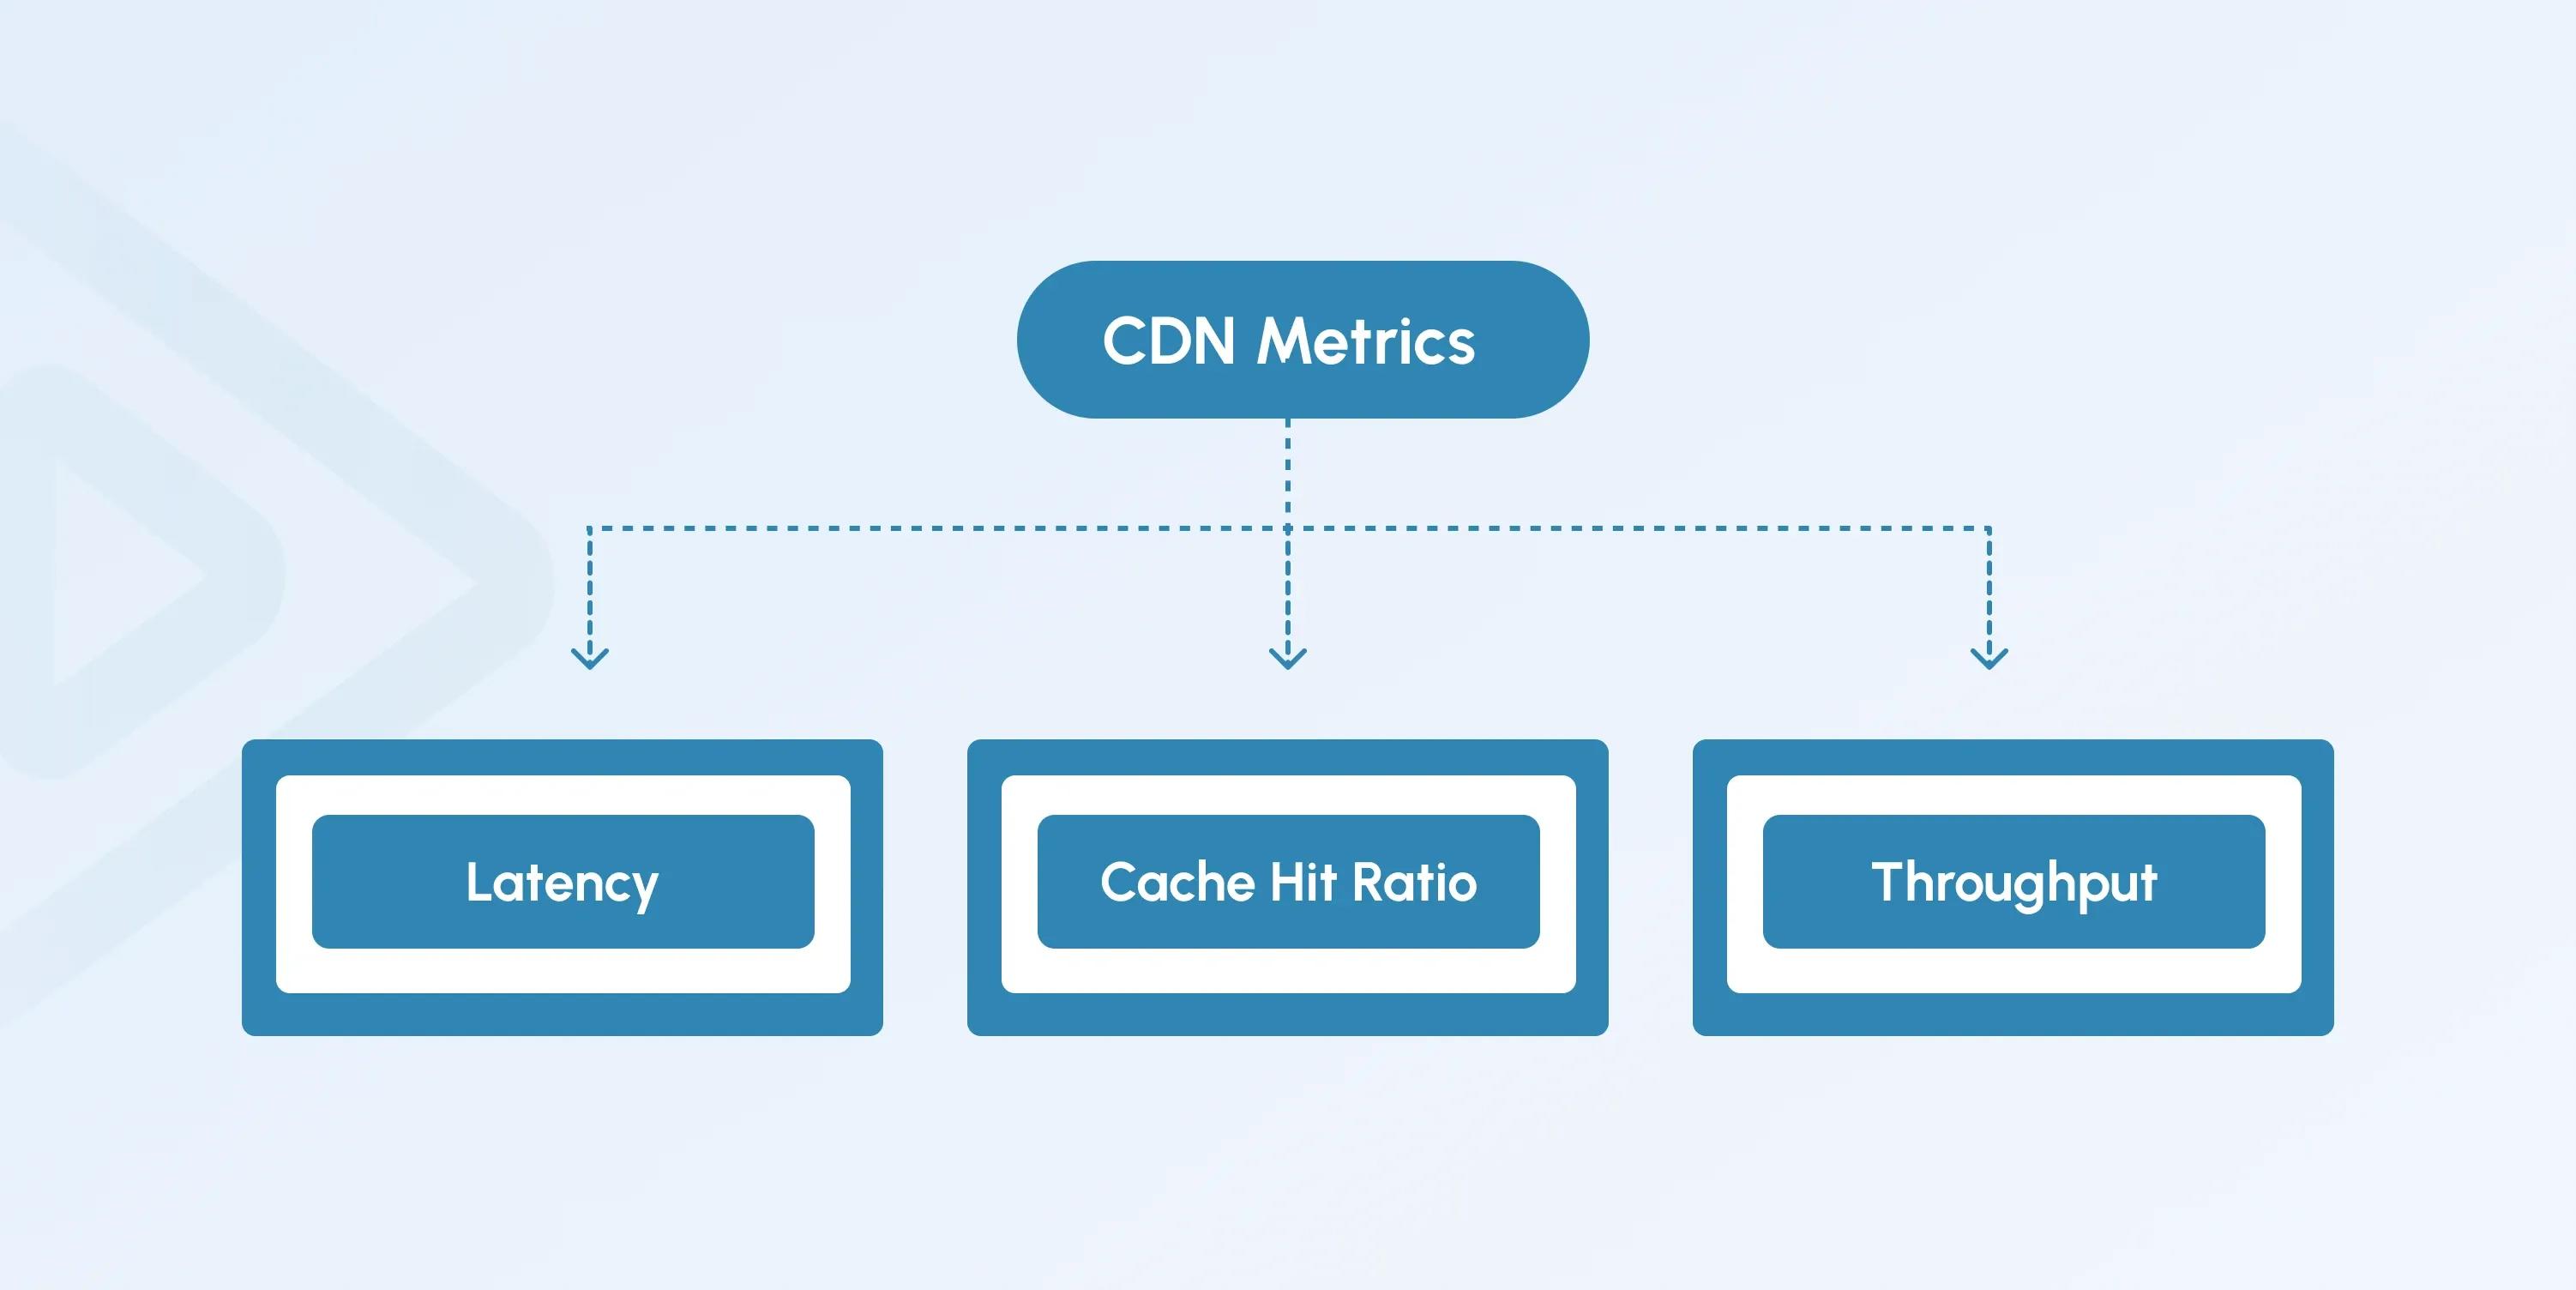
- Latency: Measures the time taken to process and deliver video requests. Low latency is crucial for live events and high-demand content.
- Cache Hit Ratio: Indicates how often a CDN serves content from its cache instead of fetching it from the origin server. A higher ratio reduces operating costs, speeds up delivery, and alleviates server load.
- Throughput: Measures the volume of data delivered by the CDN within a given timeframe. High throughput ensures the network can handle peak traffic without performance issues.
Use CDN video performance metrics to understand regional performance variations. Also, optimize cache settings to maximize efficiency and scale CDN resources dynamically during high-demand periods.
Engagement and Audience Metrics
To gain deeper insights into audience behavior, OTT and IPTV platforms can track advanced video performance metrics beyond standard engagement.
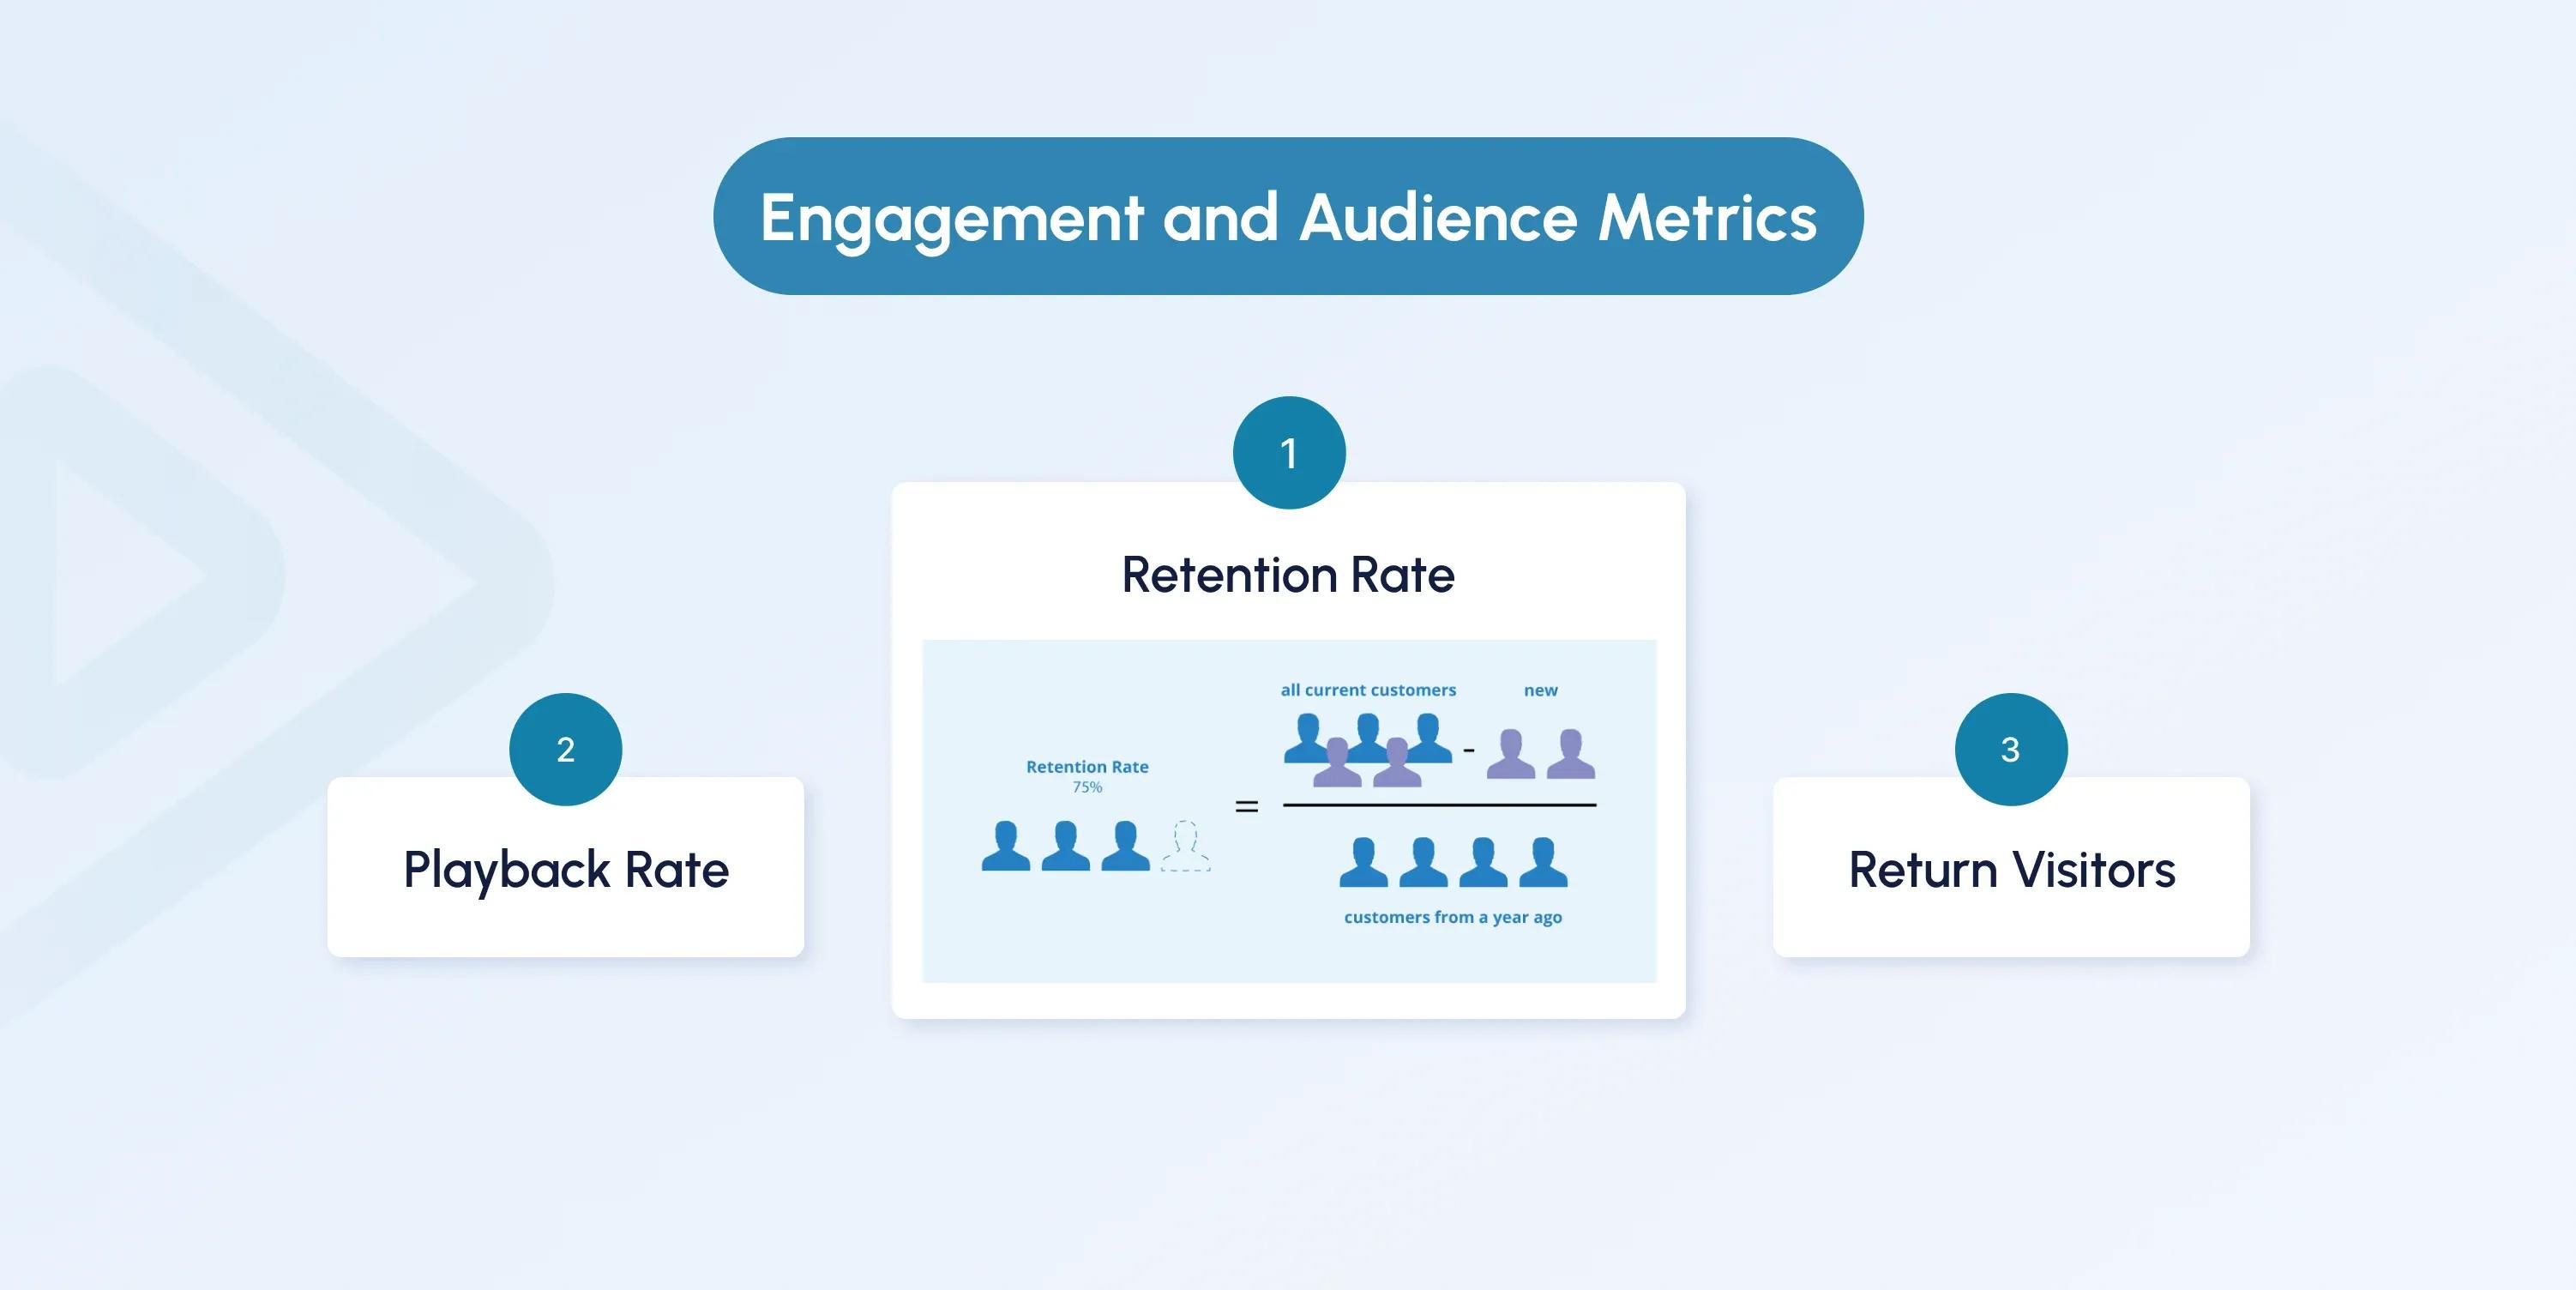
1. Retention Rate
Measures how much of a video viewers watch before dropping off. This helps identify weak points in content pacing or narrative structure.
2. Playback Rate
Tracks the percentage of users who start a video after landing on its page. Low playback rates may indicate unappealing thumbnails or misleading titles.
3. Return Visitors
Monitors how often users return to your platform. High return rates indicate strong content loyalty and user satisfaction.
Importance of Monitoring Video Streaming Performance Metrics
Maintaining the success and expansion of your OTT or IPTV offerings depends on closely monitoring video streaming performance metrics.
These numbers offer a practical analysis of your streaming platform's quality, dependability, and impact.
The five primary considerations below explain why monitoring these indicators is essential:
Enhancing Viewer Experience
Directly affecting user satisfaction are performance indicators like buffering rates, startup time, and video quality. Monitoring these indicators helps you spot and fix technical problems quickly. There is a guarantee that your viewers will have a flawless and continuous streaming experience.
Optimizing Content Delivery
Measures like bitrate efficiency and CDN latency enable you to assess the performance of your content delivery system. Especially for viewers in different locations, this information allows you to make required changes to enhance video transmission speed and consistency.
Increasing User Engagement
View time and retention rates give information on how viewers interact with your content. Knowing these habits enables you to customize your content strategy to fit audience tastes, hence increasing general interaction.
Reducing Churn Rates
Monitoring audience contentment and playback problems helps you to solve elements that could cause user discontent and finally turnover. Finding and fixing such problems improves customer loyalty and helps to keep viewers.
Improving Revenue Streams
Metrics linked to monetization, such as membership renewals or ad completion rates, provide you with an understanding of your platform's financial situation. These numbers enable you to maximize revenue by helping you fine-tune marketing, pricing strategies, or subscription plans.
Tools and Techniques for Tracking Performance Metrics
Effectively monitoring video streaming performance metrics requires advanced tools and techniques to collect, analyze, and act on data insights. Here are some essential solutions to optimize your OTT or IPTV platform’s performance:
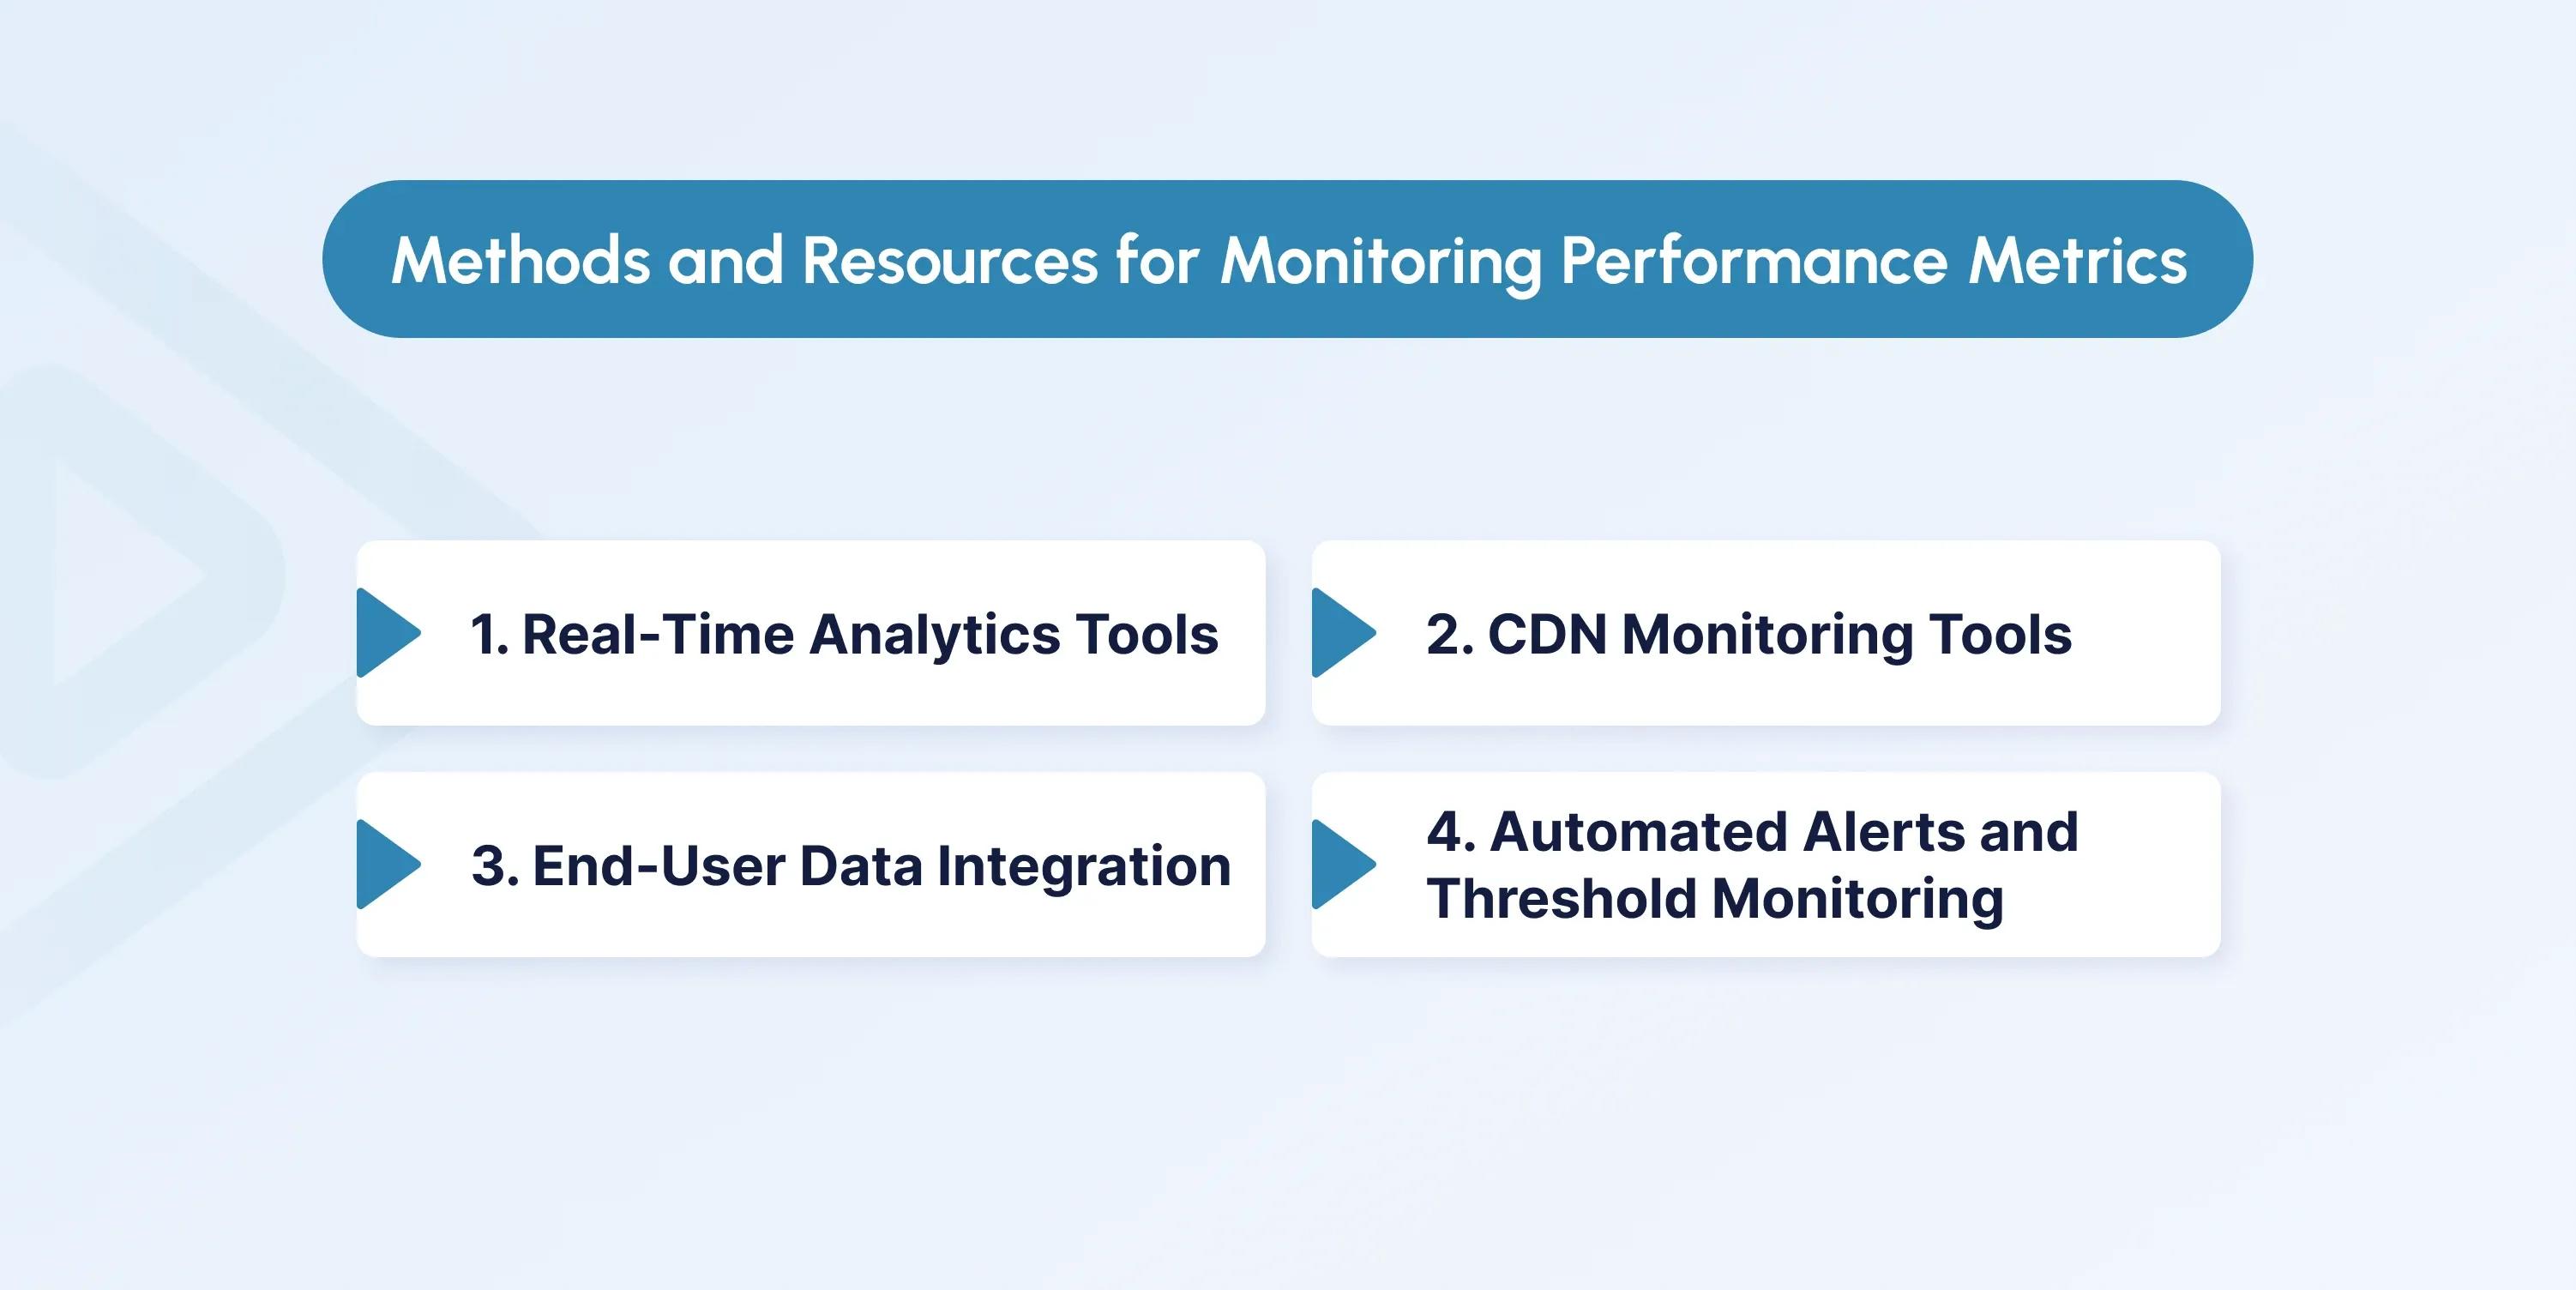
1. Real-Time Analytics Tools
Platforms like Mux and Conviva provide comprehensive analytics on audience engagement, playback quality, and network performance.
- Key Metrics Monitored: Video bitrate, start-up time, buffering rates, and more.
- Benefit: Rapid identification and resolution of issues with clear data visualization through integrated dashboards.
2. CDN Monitoring Tools
Content Delivery Networks (CDNs) like Akamai and Cloudflare include built-in analytics for tracking content delivery metrics.
- Key Metrics Monitored: Latency, cache hit ratio, bandwidth usage, and geographic performance.
- Benefit: Optimize regional content delivery and scale resources dynamically during peak traffic.
3. End-User Data Integration
Combine CDN analytics with end-user data to gain a holistic view of content delivery streaming performance. This provides actionable insights into viewer experiences across devices and locations.
4. Automated Alerts and Threshold Monitoring
Set performance thresholds for critical metrics, such as buffering rates or start-up times. Automated alerts notify your team of anomalies, allowing proactive troubleshooting before users are impacted.
By leveraging these tools and techniques, you can enhance video quality monitoring and maintain optimal streaming performance, ensuring a superior viewing experience for your audience.
How inoRain Optimizes Video Streaming Performance
 inoRain enhances video streaming performance by combining user-oriented solutions meant for OTT systems with modern technologies.
By providing real-time insights and key performance indicators, including buffering rates, playback quality, and audience engagement, inoRain’s modern analytics tools let you solve issues before they impact your consumers.
Contact us to get a white-label OTT platform with optimized video streaming platform compatibilities.
Conclusion
Delivering an exceptional OTT or IPTV experience hinges on understanding and optimizing key video streaming performance metrics, such as buffering rate, video start-up time, and CDN performance. These insights not only enhance viewer satisfaction but also drive engagement and retention, key factors in platform success.
FAQs
How does the buffering rate impact the user experience?
High buffering rates disrupt playback, leading to frustration and potential viewer loss. Maintaining a low buffering rate is essential for user satisfaction.
What is the ideal video start-up time for OTT platforms?
Start-up times under three seconds are considered optimal. Delays beyond this threshold can cause users to abandon the platform.
How does CDN latency affect video performance?
CDN latency determines how quickly content is delivered to viewers. High latency results in delays and buffering, reducing the overall viewing experience.
Co-founder / CTO
Armen is the CTO and Co-Founder of inoRain OTT and Co-Founder of HotelSmarters, specializing in advanced streaming technologies, OTT strategy, and interactive TV systems. He builds scalable end-to-end video delivery solutions and drives technical innovation across hospitality and streaming platforms, bridging complex engineering with practical business impact.
Subscribe to Our OTT Blog
Want to learn more about OTT technology and monetization? Leave your best email here, and we'll keep you updated with our weekly articles.
Loading...